
 During a recent consulting engagement I found myself once again re-inventing a formula in Excel for modeling commission calculations to estimate the cost of the plan at various points above and below 100% attainment. This task is complicated by the infinite variations on how acceleration can be designed. While every plan is different the common structure always uses an annual target variable (ATV) and an associated quota resulting in a personal commission rate (PCR, also known as base commission rate or BCR). I decided to create a general commission formula that was flexible enough to be reusable year after year during multiple engagements and I am sharing it so you don’t have to reinvent it every time you’re thinking about changing your commission plan structure.
The Excel formula that drives this model is the most complex I’ve ever written or ever seen for that matter. The key to making this easier for you or your Sales Ops analyst to audit it is the use of named global variables and a structured layout in Excel. You will find the formula in the linked Excel workbook in cell C28. The variables in the workbook (in blue font) can be changed to simulate variations on your proposed comp plan. Note: If you use this file as the basis for your analysis, the 32 named global variables are already defined and you’re good to go but if you move the formula to another workbook it will not function until you redefine the global variables there.
 The values you need to input are in blue font while calculations are in red font. You need to enter the annual quota, the annual target variable, the number of times your commission rate changes in your model (called inflections), for each of those inflections, where they occur as a percent of quota and finally, how much the PCR is increased or decreased by the multiplier. For example, if the PCR is 3% and at 100% of quota it changes to 6%, the first inflection is at 100% (expressed as a percent of quota) and the multiple is 200% (expressed as a percentage of the PCR).
Using this model you can define inflection points both above and below quota. I have included columns labeled “Attainment Range” and “ACR” to make it easier to understand the effect of the inflections and multipliers. Commission rates above the PCR are collectively called accelerators and individually referred to as an accelerated commission rate or ACR. Plans usually have more than one ACR. This model allows up to five ACRs.
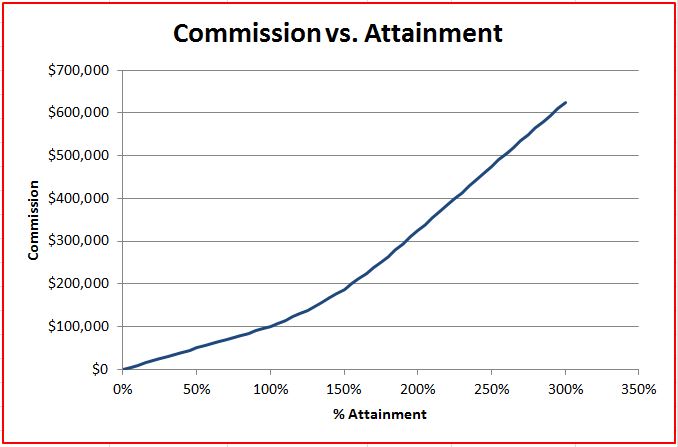
The spreadsheet also includes a line chart which attempts to graphically illustrate the inflection points.
Here is how the chart appears for a model that has four inflections at 100%, 125%, 150% and 175%.
The inflections are subtle and not easy to see in the chart. The simplest way to identify them is by looking at the difference in incremental commission at given stages of attainment. A table is included in the spreadsheet with a column that shows the amount of commission earned for each 5% increment of quota. Where those incremental commission amounts change is where the inflections occur.
The common question asked by sales management to validate that the designed acceleration is appropriate is, “what does my rep earn if he reaches X% of quota?” With minimal guidance from Sales Ops the Sales VP can test “what if” scenarios on their own by entering the proposed attainment in one cell while seeing the result in another. They can also adjust the inflection points and multiples in real-time until they are satisfied that plan cost and sales rep motivation are properly balanced.
When your commission plan includes more than a single component this model may have to be replicated to capture the entire effect of the attainment of more than one component on commissions.
Caveats: This model assumes there is one inflection point at 100% of quota. Deviations from this approach are rare. I should also mention that I haven’t tested every possible permutation of this model so use it carefully.
Please let me know if you discover any issues or have suggestions for enhancements. I’ve already made one change at the request of a Sales VP to include the capability for below-quota inflections which also has to address the “forced” commission rate calculation to get to 100% of ATV at 100% of quota. I will be happy to further improve the model to address other common structures. After all, I plan on using it myself the next time I’m modeling commission calculations!
Cheers!
Bob Bacon
Hi Bob,
I found your model very useful.
I have an incumbent comp plan based on commission and no bonus, for a set of different products (different in effort and skills needed). The KPI to improve are churn of top performers and overall productivity.
My first thought, in order to give value asap, is to work on diacronic components of the CP, missing at the time of today. That is, cut compensation in two parts (commission and bonus), set bonus on a longer period with respect to commission, in order to improve both churn and productivity. For the bonus I will use your useful model.
My client current model is anyway lacking of a lot of things: territories have different potential (no data available) and the CP does not reflect this; commission payouts for the products do not rely on actual performance and effort; data on average effort needed to sell every different product is not available; no coaching; no teamwork; etc. At the moment, being a very new salesforce (on a mix of new and old products), the CP seems to be based just on management perception. The point is to begin to improve from asap. How would you start?
Hi Piero,
Thanks for your comments. This link is to an article I wrote a few years ago on comp plan design. http://bobbacon.net/blog/?p=123 It outlines the steps required to design an effective plan. Designing a plan that is perceived as being based on objective metrics will probably go a long way toward decreasing churn! Including acceleration of their commission rate once quota is achieved (what you call a bonus) might help with the productivity KPI.
Good luck!
Bob
Hi Bob,
When I saw your megaformula, my jaw dropped.
I am the co-founder of 5thcents Technologies, and we have developed a system for analysing complex Excel formulas. Before I saw your formula I had never seen one this long. I wasn’t sure our system would cope with that formula, but it did. I am hoping to find out if you or some of your clients would be interested in trying out our system, called SKUAREROOT, https://www.skuareroot.com
We will be happy to explore opportunities for networking and partnership.
Blessing Museki
Hey Bob
Thanks for all the hard work! I appreciate the article and the spreadsheet. Any chance I can grab a few minutes of your time?
Bob,
Thanks for the insights and comp model. Very helpful. More broadly, as we design comp plans and set quotas – what would be an ideal target to shoot for in terms of: 1) % of sales reps that make or overachieve plan and, 2) Do you recommend using those multipliers you have in your model or is that mostly just for software sales? Our sales reps sell very large enterprise deals (ie. >$20M) that can be very lumpy.
Hi Spencer,
Commission plans need to be designed to best motivate your particular team taking into consideration the uniqueness of your business. The multipliers I left in the spreadsheet for illustrative purposes are typical for individual contributor sales resources selling enterprise software. They are necessarily high to be competitive in the enterprise software industry. Your multipliers should be based on the standards in your industry.
The desired percent of sales resources making quota seems to be more standard across industries based on my reading. Your target should be in the range of 65% to 75%. Given attrition and ramping of new hires it generally takes that average success rate to make the company number!
Good Luck!
Bob
Dear Bob
Could you help on the calculation when we are moving from one inflection to another, for example considering the “Rate inflection below Quota”.
From starting point for example 5%
100000*5%*50% = gives the same answer of yours, but when I move to next inflection 1 calculation of 30%
100000*30%*75% doesn’t give the same answer of yours.
Assist me on the concept.
Sorry to reply so late but I just saw your note and I’m afraid I don’t understand your question. If you are still looking for input could you please label the variables? Is the 5% the PCR? Is the $100,000 the annual target variable? Is the 50% a single inflection point or part of a multiple point inflection curve or is it the attainment you want to test.
What is the 30% and 75%?
Hi Bob,
Very nice spreadsheet. This will help me enormously.
I have one question maybe you can assist.
Why isn’t there a value for the Below Quota->Inflection 3->Multiplier?
Also, Cell E24, which is the Below Quota->Inflection 3->BQ Rate, changes based upon changing the BQ Rate above it.
Thank you,
John
Hi John,
Thanks for writing! The multiplier for the last inflection point before 100% of quota (Below Quota-Inflection 3 in your question) is the multiplier required to reach 100% of variable at 100% of quota. Remember, that’s one of the assumptions built into the model.
Cheers!
Bob
Much appreciated, Bob!
The excel link is not found, was this changed? If so, may you provide me with the updated link. I am interested in seeing your formula.
Much Thanks.
Hi Danielle, this link works for me but it’s the same link in LinkedIn. http://bobbacon.net/blog/archives/690
Sorry, don’t know why is would not work for you.